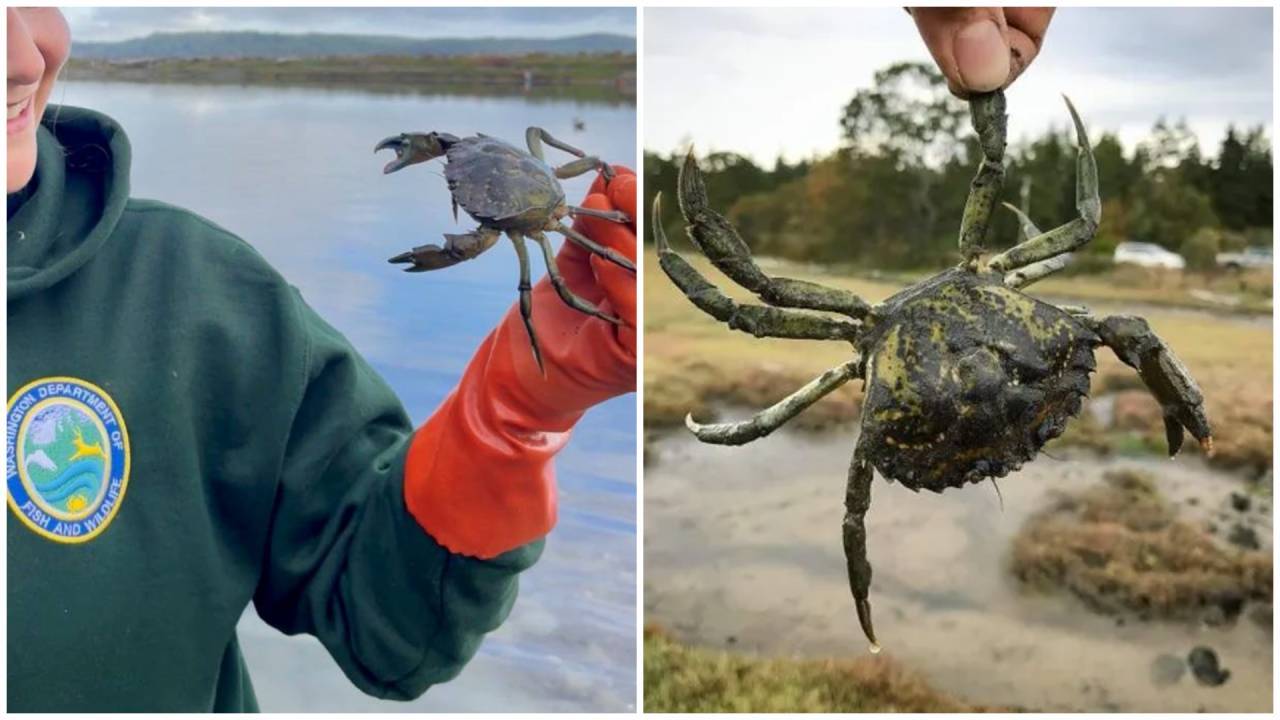
Record harvest numbers do not equal biological control when a species reproduces exponentially and disperses via pelagic larvae. Removing 2.16 million invasive green crabs (Carcinus maenas) in Washington demonstrates high trapping effort and localized depletion, yet population persistence depends on recruitment rates, larval connectivity across estuaries, and habitat carrying capacity rather than cumulative removals alone.
This analysis deconstructs the standard "record harvest equals progress" narrative into a structured operational framework. It maps how trapping effort interacts with population biology, identifies the causal bottlenecks that allow invasions to rebound, and outlines a disciplined management sequence for coastal agencies and shellfish operators.
Deconstructing the Record Harvest Narrative
Standard reporting on invasive green crab removals treats cumulative catch totals as a direct measure of ecological recovery. In population management, a record catch is an output metric of effort and density, not an outcome metric of eradication or suppression.
When agencies report a surge from prior years to 2.16 million captured green crabs, two distinct interpretations compete:
- Effort and Expansion Interpretation: More traps deployed across more shoreline miles, combined with higher local abundance in newly colonized bays, mechanically increases catch volume.
- Suppression Interpretation: High removal counts reduce standing stock below a biological threshold, slowing future population growth.
A surge in removals can occur even while the total breeding population grows, provided recruitment outpaces mortality or previously unmonitored habitats enter the trapping network. Treating gross catch as net suppression confuses harvesting yield with population collapse.
Where Conventional Reporting Misses Cause and Effect
Conventional coverage typically links big removal numbers directly to warnings that the invasion continues. That pairing states two facts side by side without explaining the mechanism connecting them.
The missing causal chain runs through life-stage bottlenecks and dispersal. Adult and sub-adult green crabs trapped in intertidal and shallow subtidal zones represent the visible, harvestable fraction of the population. The invisible driver of future expansion is the planktonic larval stage, which rides tidal currents and coastal circulation into adjacent estuaries, plus cryptic juveniles tucked into eelgrass, marsh banks, and oyster shell beds where standard baited traps under-sample smaller size classes.
The Three Pillars of Invasive Green Crab Persistence
To evaluate whether a removal program is bending the population curve or merely cropping surplus production, managers need a structural model of persistence. Invasive green crab resilience rests on three interlocking pillars: fecundity and recruitment, hydrodynamic dispersal, and habitat heterogeneity.
Fecundity and Recruitment Dynamics
Female green crabs possess high reproductive output and tolerance for broad temperature and salinity ranges. Even when trapping removes millions of individuals, surviving reproductive females in refuge habitats can generate large cohorts of larvae.
Population trajectories follow density-dependent dynamics rather than simple linear subtraction:
- Compensatory survival: Reducing dense adult cohorts can lower intraspecific competition (such as cannibalism by larger crabs on smaller juveniles), allowing a higher share of remaining juveniles to survive to maturity.
- Size-selectivity bias: Baited traps tend to capture mobile crabs above a size threshold determined by trap mesh and bait attraction, leaving small juveniles less represented in catch totals until they grow into trappable classes.
Hydrodynamic Connectivity Across Estuaries
Estuaries and bays in the Pacific Northwest do not function as isolated boxes. Tidal exchange, wind-driven surface currents, and seasonal coastal flow link embayments into a connected network.
A bay subjected to intensive trapping can still experience re-infestation if currents deliver larvae spawned outside that embayment or from deeper, harder-to-trap margins. Conversely, suppressing source populations in key estuaries can reduce larval supply to downstream sinks, though the exact strength of that link varies by season and water column structure.
Habitat Heterogeneity and Refugia
European green crabs thrive across a wide spectrum of shoreline types, including mudflats, salt marshes, gravel beaches, rocky margins, and estuarine channels. Shallow, warm backwaters and vegetated edges often warm faster in spring and summer, accelerating molting and growth rates.
Trapping efficiency is uneven across these microhabitats. Steep banks, dense root mats, wide tidal flats with shifting channels, and deep subtidal zones limit trap placement and servicing frequency, creating functional refugia where reproduction and recruitment continue uninterrupted.
The Cost Function of Coastal Eradication
Eradication is economically and operationally feasible only when the marginal cost of finding and removing the last remaining individuals stays below available budget and before recolonization resets the count. For an established, wide-ranging estuarine invader like Carcinus maenas, total eradication across an entire regional coastline is generally not a realistic baseline objective; functional suppression in high-value zones is the practical operational target.
Fixed, Variable, and Escalating Search Costs
A sound cost function for invasive green crab control separates three cost components:
- Fixed infrastructure and program costs: Boats, vehicles, traps, bait supply chains, data systems, gear maintenance, and trained field crews.
- Variable effort costs: Labor hours per trap-night, travel time between sites, processing and disposal of captured crabs, and gear losses to tides or storms.
- Diminishing-returns search cost: As local density drops in a trapped area, the cost per crab captured rises sharply because crews must cover the same shoreline to catch fewer animals.
If a program allocates budget purely to maximize raw crab counts, crews naturally concentrate effort where catch-per-unit-effort (CPUE) is highest—often high-density or newly booming sites—while under-investing in perimeter containment or early-detection trapping in low-density systems where preventing establishment yields high long-term value.
Why Removal Alone Rarely Produces Permanent Zero
Stopping all immigration and reproduction across complex tidal landscapes requires continuous, high-frequency coverage over multiple crab generations. Any funding gap, seasonal lull, or unmonitored sub-basin allows surviving breeders and incoming larvae to rebuild numbers.
Facts Versus Educated Hypotheses in Invasion Management
Disciplined strategy requires separating verified operational facts from working hypotheses that guide adaptive management.
| Dimension | Known Facts | Educated Hypotheses (Require Ongoing Verification) |
|---|---|---|
| Removal Scale | Millions of invasive green crabs have been removed in Washington over recent trapping campaigns, reaching a record 2.16 million. | High multi-year removal totals are already slowing regional expansion rather than primarily reflecting higher effort and newly colonized areas. |
| Ecological Impact | Green crabs are generalist predators capable of preying on native bivalves, juvenile crustaceans, and estuarine invertebrates and altering intertidal habitats. | Specific local declines in commercial shellfish or native crab species in a given bay are caused primarily by green crabs rather than concurrent shifts in water temperature, disease, or harvest pressure. |
| Control Effectiveness | Intensive, sustained trapping can reduce local catch rates in targeted sub-estuaries while effort is maintained. | Targeted suppression in priority source bays measurably lowers larval settlement in neighboring estuaries over multi-year cycles. |
Operational Playbook for Suppression and Risk Mitigation
Because no single silver bullet eliminates an established estuarine invader, effective control requires treating green crab management as a continuous production and containment operation rather than a one-off cleanup.
Step 1: Standardize Catch-Per-Unit-Effort Across Habitats
Track catch per trap-night alongside trap type, soak time, bait type, tide stage, and habitat class. Raw totals without effort normalization obscure whether abundance is rising, falling, or shifting spatially.
Step 2: Tier Sites by Ecological and Economic Vulnerability
Classify bays, estuaries, and shoreline segments into operational tiers based on vulnerability and connectivity:
- High-value protection zones: Commercial and tribal shellfish beds, juvenile salmon rearing estuaries, and sensitive native habitats where small increases in predator density carry high economic or ecological cost.
- High-production source zones: Warm, productive backwaters and extensive intertidal habitats where rapid growth and high abundance generate large numbers of crabs.
- Early-detection frontier zones: Newly reached or low-density inlets where rapid intervention can suppress founder populations before they establish dense breeding colonies.
Step 3: Synchronize Trapping With Seasonal Biology
Concentrate trapping effort during periods when green crabs are most active and accessible in shallow intertidal and nearshore zones—typically warmer months when foraging and movement increase—while using cooler periods for gear overhaul, data audits, site mapping, and regulatory or partner coordination.
Step 4: Pair Physical Trapping With Biosecurity and Habitat Controls
Physical trapping addresses standing mobile stock, but long-term resilience depends on complementary controls:
- Vector and movement controls: Prevent accidental transport of live crabs or fouled gear and shellfish stock between waterbodies.
- Native predator and habitat considerations: Avoid actions that degrade native estuarine structure or further stress native predators that compete with or prey upon small crabs.
- Multi-stakeholder reporting: Integrate agency trapping data with shellfish grower observations, tribal resource teams, and vetted monitoring networks so anomalies trigger rapid response.
Step 5: Enforce Stop-Loss and Reallocation Rules
Set explicit performance triggers for every trapped site. When CPUE in a mature zone falls to low levels and marginal cost per crab rises steeply, reallocate trap-nights to higher-priority protection or containment sites rather than chasing diminishing returns indefinitely.
Limitations and Strategic Forecast
Every suppression strategy carries hard constraints. Tidal windows limit field hours, storms damage gear, budgets face annual appropriation cycles, and complete isolation of open coastal waters is impossible. Over-relying on volunteer or ad-hoc trapping without standardized protocols can also produce noisy data or inconsistent coverage.
Looking ahead, Washington's green crab challenge will be decided by allocative discipline rather than headline catch totals. Agencies and coastal partners that pair standardized CPUE tracking, risk-tiered site allocation, and sustained seasonal pressure in priority estuaries will contain damage in high-value bays even as background persistence continues across harder-to-reach habitats. Programs that measure success solely by ever-larger harvest numbers will keep reporting records while watching the underlying invasion adapt around them.