Paris, 1900. The air hums with the electric promise of a new century. Beneath the soaring iron arches of the Exposition Universelle, nations parade their industrial might, their technological triumphs, and their absolute certainty in the superiority of their empires. In the American Palace, a small exhibition catches the eye of unsuspecting visitors. It is not a locomotive, nor a bolt of silk, nor a towering model of a bridge.
It is a series of hand-drawn charts, glowing with vibrant geometric shapes, bold greens, deep reds, and striking blacks. If you found value in this post, you should read: this related article.
They are crafted with meticulous, agonizing precision. Behind them stands a thirty-two-year-old scholar who has spent months in the sweltering heat of Georgia and the libraries of Philadelphia, drowning in census reports, tax receipts, and handwritten ledgers. His name is W.E.B. Du Bois. He looks out over a world that views his people through a thick, suffocating fog of caricature, prejudice, and assumed inferiority.
He holds a pen. And he decides to draw a different picture. For another angle on this event, see the latest update from TIME.
The Weapon of Rigor
To understand what Du Bois achieved, you must first understand the weapon he was handed. In the decades following the collapse of Reconstruction, white supremacy in America did not merely rely on physical violence or the ballot box; it relied on a narrative. A pseudo-scientific consensus hummed through newspapers, academic journals, and political speeches, whispering that Black Americans were inherently lazy, intellectually stunted, and incapable of self-governance.
Statistics were weaponized. Crude tables and biased measurements were paraded as immutable proof that freedom was a failed experiment.
Du Bois saw the trap. He knew that arguing with emotion against a machine built on cold, hard numbers was like shouting at a hurricane. You cannot out-shout prejudice with poetry alone. You have to beat them at their own game. You have to out-measure them.
So, in 1899, armed with paste, ink, compasses, and a staggering intellect, Du Bois and a team of students at Atlanta University set out to document the actual, breathing reality of Black life in Georgia. They walked dirt roads. They knocked on doors. They cataloged property ownership, literacy rates, occupational shifts, and family structures. They gathered thousands of data points about a people who had been legally classified as property just a few decades prior.
Then came the revolutionary leap. Du Bois realized that raw numbers buried in dry academic monographs would never reach the general public. They would gather dust on library shelves.
Data had to be seen. Data had to hit the eye before it could reach the brain.
Colors of Truth
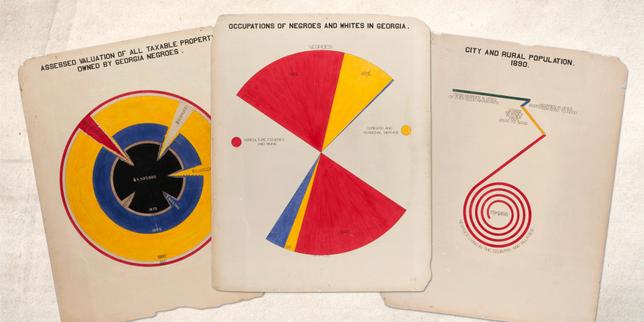
Look at plate number one. The spiral chart.
Imagine standing before it in Paris. Your eye is drawn inward, following a twisting, expanding line that maps the valuation of property owned by African Americans in Georgia over time. It is not just a line graph; it is an explosion of growth against staggering odds. It tells a story of accumulation, sacrifice, and fierce determination without using a single adjective.
Du Bois bypassed traditional Victorian bar charts. He predated modern data visualization by decades, inventing forms of visual storytelling that would look at home in a modern design studio today. He used vivid primary colors—crimson, emerald, gold—not for decoration, but to shock the viewer out of their complacency.
A spiral showing the valuation of land. A bar chart breaking down the proportion of free versus slave ancestors of Georgia Negroes. A map tracing the migration and distribution of the population across southern counties.
Each chart was an argument carved in ink.
Consider the psychological impact on the European and American elites walking through that exhibition hall. They expected to see exhibits on southern agriculture or industrial output that quietly reinforced racial hierarchies. Instead, they walked into a room curated by a Black intellectual that systematically dismantled those hierarchies using the colonizer’s own tools: science, evidence, and empirical truth.
The charts shouted what polite society refused to whisper: progress is happening, despite every barrier placed in the way.
Beyond the Numbers
Numbers can lie if you let them, but Du Bois refused to let them detach from humanity.
When you look at his plates, you are not just looking at percentages. You are looking at the direct lineage of people who were bought and sold, now building schools, establishing banks, and buying land. You are looking at the quiet, revolutionary act of survival.
Consider what it meant to be a Black scholar in 1900. Du Bois held a Ph.D. from Harvard. He had studied in Berlin. Yet, walking down the streets of Atlanta or riding a segregated train car, he was treated as a second-class citizen, denied basic human dignity, and locked out of the academic institutions that should have welcomed him with open doors.
Every stroke of his pen was an act of defiance. Every calculation was a refusal to accept the script written for him and his community.
He understood that if you control how a people are measured, you control how they are treated. If you portray them as a monolith of stagnation, you justify their oppression. But if you reveal their complexity, their regional variations, their economic struggles, and their undeniable triumphs, you make systemic injustice indefensible.
The Architecture of Clarity
Why do these charts still resonate today?
Because they remind us that the fight for justice is also a fight for truth. In an era overflowing with misinformation, bad-faith statistics, and distorted narratives, Du Bois’s methodology remains a north star. He did not invent facts to fit his desires; he uncovered the hard, complicated, beautiful truth and let it speak for itself.
The Paris Exposition awarded his charts a gold medal. But the true prize was something far more enduring. He laid down a blueprint for how marginalized communities could use empirical evidence to shatter the glass ceilings of public perception.
The ink has long since dried on those heavy sheets of cardboard in the Library of Congress. The world has shifted on its axis many times over since 1900. Yet, when you look at those vibrant, hand-drawn lines, you can still feel the pulse of a man refusing to let his people be erased by a lie.
The data was never just about numbers. It was about giving shape to a future that hadn't happened yet.