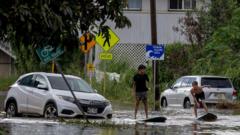
The declaration of $1 billion in damages following a severe storm cycle in Hawaii is not merely a fiscal data point; it represents a critical failure threshold in the state’s current infrastructure and land-use paradigms. While headlines focus on the immediate chaos of rain and wind, the actual economic reality is defined by the intersection of antiquated drainage systems, high-velocity runoff on volcanic topography, and the extreme cost of material logistics in an isolated island economy. The $1 billion figure serves as a lagging indicator of a systemic inability to decouple essential economic activity from predictable atmospheric volatility.
The Triad of Loss: Dissecting the Damage Functions
To understand why a storm cycle reaches a ten-figure loss, the damage must be categorized into three distinct economic buckets. These buckets represent the "Cost Function of Insular Disasters," where geographic isolation acts as a multiplier for every dollar of physical destruction.
1. Primary Physical Asset Degradation
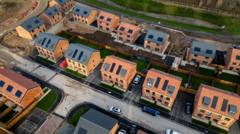
This includes the immediate destruction of residential structures, commercial real estate, and government buildings. In Hawaii, the cost per square foot for reconstruction is significantly higher than the U.S. national average due to the "Jones Act" and general shipping premiums. When a storm destroys a roof in Honolulu or Hilo, the replacement cost includes a 20-30% "isolation tax" for imported lumber and specialized labor.
2. Lifeline Infrastructure Failure
The most significant long-term costs stem from the breakdown of "lifeline" systems: power grids, water treatment, and transportation arteries. Hawaii’s topography dictates that major transit routes—like the Pali Highway or the H-1—often have no redundant alternatives. A single landslide does not just damage a road; it severs the supply chain for entire regions of an island, creating a "bottleneck cost" that far exceeds the price of the asphalt required for the repair.
3. Productivity and Opportunity Leakage
This is the "invisible" damage. When the tourism sector—the engine of the state's GDP—stalls because of closed airports or flooded resorts, the loss is permanent. Unlike a manufacturing plant that can run overtime to catch up on production, a "lost room night" in a hotel can never be recovered. The $1 billion estimate frequently underestimates the ripple effect of lost wages and tax revenue during the period of suppressed activity.
Topographic Determinism and the Runoff Trap
The severity of Hawaii’s storm damage is an inevitable outcome of its "Vertical-to-Coastal" hydraulic flow. Unlike the flat plains of the Midwest, where floodwaters can spread and dissipate over vast areas, Hawaii’s volcanic slopes act as high-velocity funnels.
The mechanism of destruction follows a predictable sequence:
- Ographic Lifting: Trade winds or Kona storms push moist air up steep mountain faces, causing rapid cooling and intense, localized precipitation.
- Saturation Velocity: Because Hawaii’s soil layers are often thin over basaltic rock, the ground reaches saturation quickly. Any additional rainfall immediately becomes surface runoff.
- Debris Loading: High-velocity water strips vegetation and loose soil (alluvium), turning a water flow into a "slurry" of debris. This slurry has the kinetic energy to take out bridges and culverts that were designed for water-only flow rates.
The failure of urban drainage systems is often blamed on "unprecedented" rainfall, but the reality is a misalignment between 20th-century engineering standards and 21st-century atmospheric energy. Most of Hawaii’s drainage infrastructure was designed based on historical "100-year flood" models that are now obsolete.
The Insurance Gap and the Federal Dependency Loop
A critical vulnerability in the Hawaii recovery model is the widening gap between economic loss and insured loss. A significant portion of the $1 billion damage will likely fall on the public sector or underinsured private owners.
Public infrastructure—roads, bridges, and piers—is rarely insured in the traditional sense. Instead, the state relies on the Federal Emergency Management Agency (FEMA) for a 75% cost-share reimbursement. This creates a "Dependency Loop":
- The state underinvests in resilient infrastructure because the upfront cost is high.
- A disaster occurs, triggering federal aid.
- The aid is used to rebuild the infrastructure to its previous state, rather than an upgraded, resilient state.
- The system remains vulnerable to the next event of similar magnitude.
This cycle ensures that the $1 billion figure will be reached again in the next decade, as the underlying fragility of the assets has not been addressed. The current fiscal strategy is reactive, treating disasters as "black swan" events rather than high-probability operational costs.
Material Logistics: The Latent Cost Multiplier
When the Governor cites a $1 billion price tag, he is also accounting for the hyper-inflationary environment of post-disaster reconstruction. Hawaii faces a unique "Logistics Bottleneck" during recovery:
- Scarcity Pricing: There is a finite pool of licensed contractors and heavy machinery operators on each island. Following a major storm, demand for these services spikes, leading to 50-100% increases in labor rates.
- Lead-Time Delays: Specialty components—such as industrial electrical transformers or bridge girders—must be shipped from the mainland. This can lead to project durations extending 18-24 months, during which time inflation further erodes the purchasing power of recovery funds.
- Environmental Compliance: Post-storm recovery in Hawaii is slowed by the need to protect sensitive marine ecosystems from sediment runoff. The cost of "Best Management Practices" (BMPs) to prevent coral reef damage adds another layer of expense to every repair project.
Redefining Resilience: From Hardening to Adaptation
The strategy of "hardening" infrastructure—building thicker sea walls or larger concrete drains—has reached a point of diminishing returns. To lower the billion-dollar risk profile, the state must pivot toward "Dynamic Adaptation." This involves three structural shifts:
Decentralized Utility Architecture
The centralization of power and water makes the entire system vulnerable to single-point failures. Moving toward microgrids and localized water catchment/treatment systems reduces the "blast radius" of any single storm event. If one valley is flooded, the neighboring valley’s utility remains operational.
Permeable Urbanism
Honolulu’s "grey infrastructure" (concrete and asphalt) must be retrofitted with "green infrastructure." By replacing non-porous surfaces with bioswales and permeable pavements, the city can use the landscape itself to absorb kinetic energy and volume from runoff, reducing the pressure on terminal drainage points.
Managed Retreat and Setback Optimization
The most difficult but necessary economic move is the relocation of critical assets away from coastal inundation zones and flood-prone valley floors. The "Sunk Cost Fallacy" often keeps businesses and homes in high-risk areas because of historical investment. However, the recurring $1 billion losses suggest that the cost of staying is becoming higher than the cost of moving.
The Strategic Path Forward
To break the cycle of disaster-and-debt, Hawaii must reclassify storm preparedness from an "emergency response" function to a "core economic development" function. The following tactical moves are required to mitigate the fiscal impact of future atmospheric events:
- Establish a State-Level Resiliency Fund: Rather than waiting for federal reimbursement, a dedicated fund should be used to provide low-interest loans for private-sector "hardening" (e.g., retrofitting commercial buildings with hurricane-grade glass and backup power).
- Implement "Build-Back-Better" Mandates: Legislative action is required to ensure that any infrastructure repaired with public funds is upgraded to meet future climate projections, not just restored to its pre-disaster condition.
- Data-Driven Risk Mapping: Utilize LIDAR and hydrological modeling to create more granular flood maps. Current maps often fail to account for the "debris flow" variables unique to volcanic terrain.
- Labor Force Pre-Positioning: Develop "Mutual Aid Agreements" with mainland construction unions and engineering firms to ensure a surge capacity of labor is available immediately after an event, bypassing the local labor bottleneck.
The $1 billion loss is a signal that the current system is calibrated for a climate that no longer exists. Until the state addresses the structural "Cost Functions" of its geography and logistics, these storm events will continue to be catastrophic disruptions rather than manageable operational risks. The priority must shift from "surviving the storm" to "engineering out the vulnerability."
Immediate action should focus on the audit of all "Category 1" transit arteries to identify single-point-of-failure landslides risks, followed by the mandatory installation of decentralized communication nodes to ensure that remote communities do not lose connectivity during the next saturation event.